
“Hello! Has anyone tested (or is there any documentation about) the line width that the EV3 light / color sensor is capable of reading? ”
Having just finished up a project and looking for something small to help me procrastinate about starting my next big task, I thought “This is an awesome way to waste time / learn something new”. And while knowing the answer is very helpful, I’m also really keen to learn from the process of getting the answer and figured the datalogging capability of the EV3 would be perfect.

It’s not a difficult thing to do, and something that you could do in your classroom / robotics club.
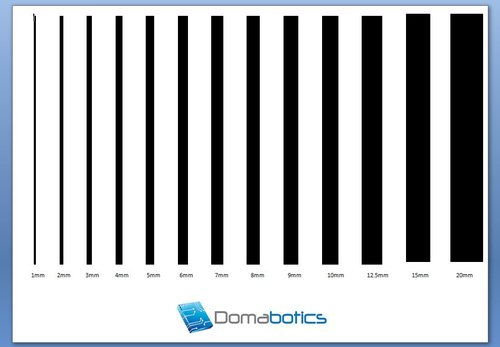
Firstly I put together a small document that has a series of lines on it. It starts at 1mm, and goes all the way up to 20mm in width. I made sure that there was a 15mm gap between each line. This was all done with Microsoft Word, and if you’d like my version, you can download it here. linetest.pdf (check your scaling if you print this out)
I then built an extrememly simple robot based on my quick build, but with the Colour Sensor on a boom mounted over the side. I didn’t want the robot driving over the lines and potentially disturbing them. The boom arm is also adjustable so I can raise and lower the height of the Colour Sensor.

I put together a very simple datalogging program as follows.
Start the robot driving (15% power)
Start Datalogging (1000 samples per second, 5 seconds)
After Datalogging has finished, stop the robot

Setup the robot over the paper, and run the experiment. I then moved the Colour Sensor up one Technic hole on the boom arm, and ran the experiment again. I did this for a total of 4 different Sensor heights.
Looking at the data shows some very interesting results.
Lowest Level:
You can quite clearly see the 13 different lines as represented by the 13 dips in the graph. Up to the 4mm line, the robot clearly sees each individual line (Colour sensor going all the way down). However while the 1 / 2 / 3mm lines all show a ‘dip’, it doesn’t get as low as the other lines. You get some weirdness on gaps between these later lines, but I think I may have had slightly wavy paper that accentuates the readings at such a close distance. (click for big version)

1 Technic Hole up:
You can still quite clearly see the 13 different lines, however by time you get to the 5mm line, it is only 50% of the original reading and subsequent lines have an even smaller drop. This is to be expected, as the Colour Sensor is higher up which means red light spreads out more as it reaches the ground and the lines now form a smaller percentage of the overall area ‘seen’ by the red light.

2 Technic Holes up:
I would say that the robot could ‘see’ up to the 5mm line. It’s iffy though and while our human eyes can discern the pattern from the graph, for 5mm, the robot is looking for a drop of 3 percentage points.

3 Technic Holes up:
Again, as we would expect, with the sensor so high up now, it’s hard for the sensor to be able to pick out the lines. At a stretch I’d say it could see the 20mm, 15mm, 12.5mm and 10mm but you’d be optimistic to say you could see any other lines.

Conclusion:
So the question was, what line width is the EV3 capable of detecting. The answer here is (as with almost all robotics) “It depends”.
If you’re going slow enough, and you know what values you expect from the light and dark areas of your mat, you could conceivable tune your program to have your robot stop on a 1mm thick line. However, this would have to be very finely tuned and wouldn’t take into account all the other weird and wonderful colours and surfaces you may conceivably drive along in getting to that 1mm thick line.
This took me a total of about 2 hours to think about, build, program and analyse. It is definitely within the reach of your typical students to run their own version of the experiment and come up with some results.
Possible modifications your students could run:
Keep the line widths the same, but vary the greyscale percentage of the line ie. 100% black, 80% black, 60% black etc.
Keep the height of the Colour Sensor the same, but vary the speed of the robot
If you do run this with your kids, let me know, I’d love to see your data!
PS. Here is all the data on one graph. The lines don’t line up because, as much as I tried, I couldn’t get the *exact* same starting position each time. If I did it again, I might setup a starting “trigger” to make sure they all line up together.
